Listen instead
Your website might look great on your laptop. The colors are right, the photos are sharp, the layout is clean. But Google isn’t looking at the design — it’s running a timer. Three specific measurements, taken from real visitor data, determine how Google ranks your site and whether the people who land on it actually stick around long enough to read anything.
Think of a door that looks beautiful from across the room. Nice wood grain, solid hardware. But every time someone tries to open it, it sticks. It takes three hard pulls to get through. That’s what a slow website feels like to a visitor — and to Google. The appearance is fine. The experience is not.
Core Web Vitals are three performance metrics Google uses to measure how your website feels to use — how fast it loads, how quickly it responds, and whether things jump around on screen.
The Three Numbers That Matter
Google measures three things. Each one has a specific threshold — a score that separates “good” from “needs work” from “broken.” These aren’t arbitrary. They come from studying what real users notice and react to.
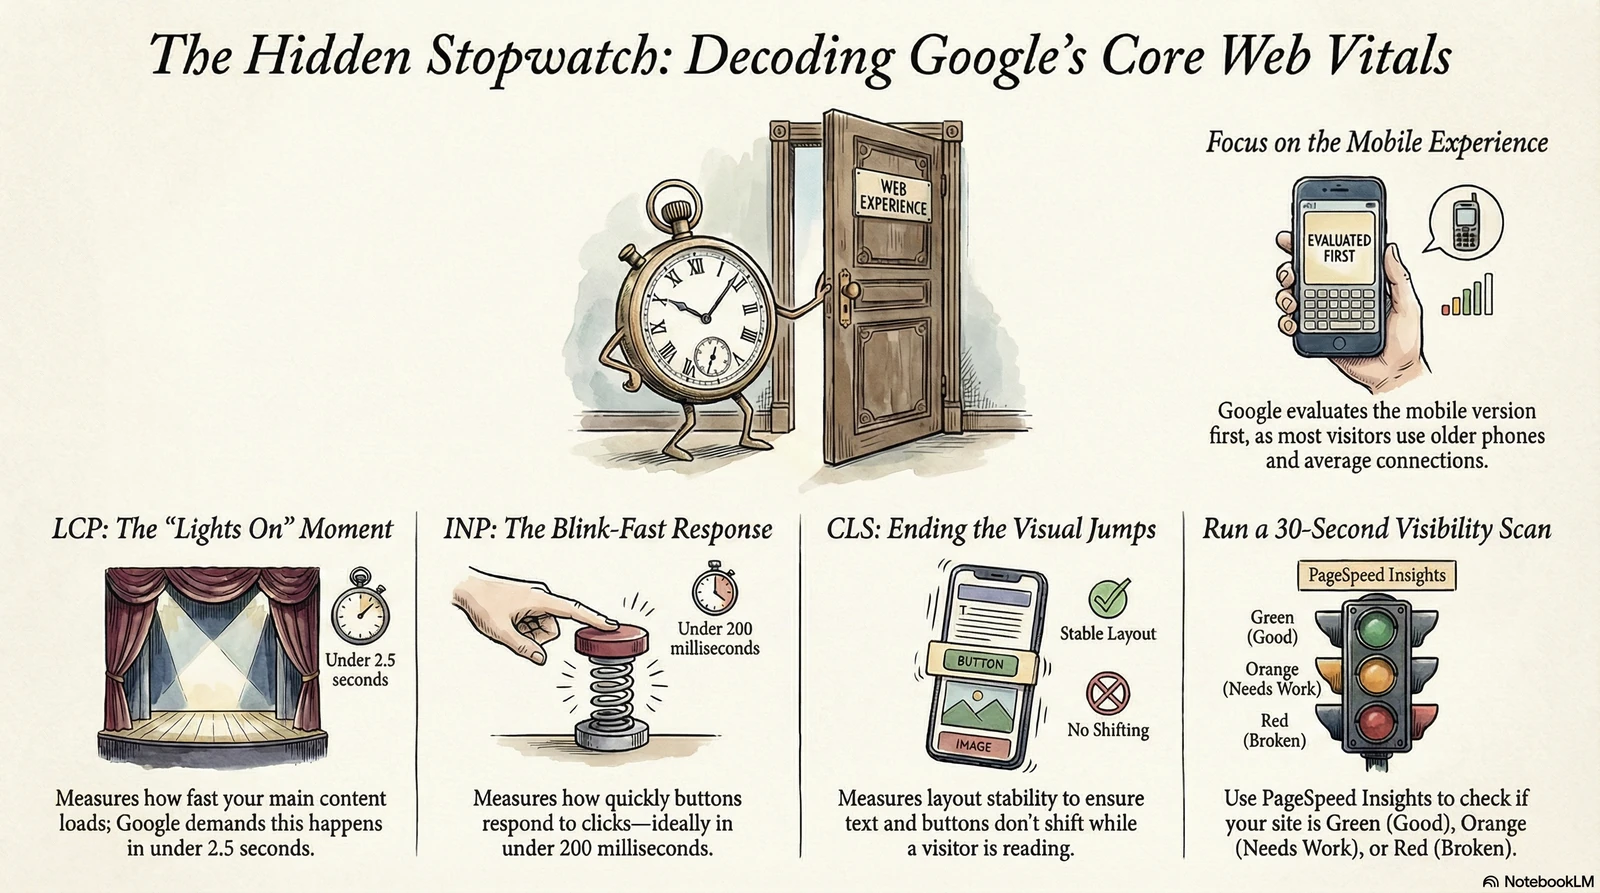
LCP — Largest Contentful Paint. How fast does the main content appear on screen? Usually that’s your hero image, your headline, or the biggest block of text at the top of the page. Google wants LCP under 2.5 seconds. Think of it like how fast the lights come on when you flip the switch. Flip it, lights on — that’s good. Flip it and wait four seconds for the bulb to warm up — that’s a problem. If your biggest piece of content takes 5 seconds to appear, most visitors have already left.
Maximum load time for the largest content element before Google flags your site
// Google Web Vitals thresholdINP — Interaction to Next Paint. How fast does the page respond when someone taps a button or clicks a link? INP replaced an older metric in March 2024 because it measures every interaction on the page, not just the first one. Google wants INP under 200 milliseconds — about the time it takes to blink. When a button feels like it “clicked,” that’s good INP. When you tap something and nothing happens for half a second, that hesitation is exactly what INP measures.
The responsiveness threshold — about the time it takes to blink
// Google Web Vitals thresholdCLS — Cumulative Layout Shift. Does stuff jump around while the page loads? You’ve experienced this: you’re about to tap a link and the page shifts, and you accidentally tap the wrong thing. That’s layout shift — elements moving around as fonts load, images render, or ads inject into the page. Google wants CLS below 0.1. Imagine trying to read a book where the words keep rearranging themselves on the page. Any score above 0.25 is considered poor. It’s one of the most frustrating things a visitor can experience on a phone.
Why This Matters for a Church Website
Picture someone on their phone after the Sunday service ends. They’re standing in the parking lot, trying to find the service times for next week so they can plan around it. They pull up the site. The page loads slowly — a large unoptimized banner image crawling in, fonts shifting the layout, buttons that don’t respond right away. After six seconds they close the tab.
They didn’t complain. They didn’t email you. They just left. And if they were a first-time visitor — someone who found you through a search — they’re already looking at the next church on the list.
For church websites, performance isn’t a technical luxury. The people you’re trying to reach are on older phones with average mobile connections. A site that performs well on your MacBook at home may be painfully slow on a six-year-old Android. Google knows this, and it ranks accordingly.
Your visitors won’t tell you your site is slow. They’ll just leave. Google will tell you — through lower rankings.

Google is running a stopwatch on every page load. Three numbers decide whether visitors stay or leave.
Why This Matters for a Business
A patient searches for a chiropractor on their lunch break. They tap your result. The page takes four seconds to show anything useful, the booking button jumps twice before they can tap it, and when they finally tap it, there’s a half-second lag before anything happens. By then the frustration is already there. They hit back and call the next practice on the list — the one with the faster site.
You never knew they visited. Google did. And over time, as more visitors bounce off a slow site and spend longer on faster competitors, Google adjusts rankings to reflect which site actually serves users well.
For healthcare practices, every lost visitor is a potential patient who chose someone else — not because of your services, your credentials, or your prices, but because the door stuck.
What to Actually Do
Go to PageSpeed Insights and paste your URL. You’ll get a score from 0 to 100. Green (90 and above) means good. Orange (50–89) means there’s work to do. Red (below 50) means it’s hurting you right now, today, in search results.
Run it on the mobile tab, not desktop. That’s the score that matters most — Google evaluates the mobile version of your site first.
The biggest culprits are almost always the same: images that were never compressed before upload, too many fonts loading at once, and scripts that block the page from rendering until they’ve finished downloading. A single unoptimized hero image can add two or three seconds to your LCP by itself.
The Artifex Visibility Report checks these automatically — performance, Core Web Vitals, image optimization, and more — and explains the findings in plain language. It takes about 30 seconds and doesn’t require any technical knowledge to read the results.
You wouldn’t hang a door without checking if the frame is square. Don’t launch a website without checking if the foundation is fast.
— the bottom line// FURTHER READING
- Web Vitals — web.dev — Google’s authoritative overview of all Core Web Vitals metrics, thresholds, and how they’re measured against real user data.
- Core Web Vitals and Google Search — Google Search Central — Official documentation on how Core Web Vitals are factored into Google’s ranking signals.
- Largest Contentful Paint (LCP) — web.dev — Deep dive on what LCP measures, what elements count, and how to diagnose and fix poor scores.
- Interaction to Next Paint is officially a Core Web Vital — web.dev — The official announcement explaining why INP replaced FID and what changed for site owners.
- PageSpeed Insights — Google’s free tool for testing your site’s Core Web Vitals scores on real user data and lab conditions. Start here.